
Bar Chart Race Generator Online Free
Turn time-series Excel (.xlsx) and CSV files into smooth 60 FPS animated bar chart races. Export ready-to-share 1080p MP4 or WebM videos in 9:16 Vertical or 16:9 Landscape with zero watermarks and zero server queues.
1-Click Starter Datasets
Drop XLSX, CSV, TSV, Markdown (.md), or JSON here
Runs locally inside browser memory. Multi-sheet workbooks open into tabs automatically.
Chart Studio & Power BI Visualizer
Client-Side RAMConvert spreadsheet columns into publication-ready charts and instant KPI cards with zero server uploads.
Metric Breakdown
Interactive visualization rendered client-side
No Numerical Data Found
Please select a column containing numbers or load a sample dataset with revenue or quantity values.
Motion Video Studio • Animated Chart Maker
Turn spreadsheet numbers into animated videos for TikTok, YouTube Shorts, LinkedIn, and presentations.
Creating Your Video
Rendering animation directly on your device...
Spreadsheet Macros & Automation Studio
Client-Side EngineExecute 1-click pro data cleaning recipes or record custom macros to replay repetitive workflows across sheets.
✨ 1-Click Pro Data Cleaners & Transformers
Instantly transforms active sheet data with full Undo (Ctrl+Z)Strip leading/trailing spaces, collapse multiple spaces, and remove non-printable characters across all cells.
Format row 1 into clean Title Case with styled emerald header background and white bold typography.
Strip $, €, £, commas, and trailing symbols from numbers so formulas and charts calculate without error.
Append a styled Total / Summary row at the bottom computing total sums and averages for numerical columns.
Detect Full Names in selected column and cleanly split into adjacent "First Name" and "Last Name" columns.
Remove identical or case-insensitive duplicate rows across the sheet while preserving header row intact.
Insert or re-number Column A with sequential row numbers (1, 2, 3...) or custom prefix (ID-001, ID-002...).
⏺️ Macro Recorder & Replay Engine
Record custom spreadsheet actions in real time and save them locally to replay on any uploaded CSV or Excel sheet.
Combine Two or More Columns
Merge 2+ columns cleanly without writing formulas.
Split Column by Delimiter
Remove Duplicate Rows
Find & Replace
Sort Rows
Filter or Delete Matching Rows
Fill, Prefix / Suffix & Extract Column
Merge Multiple Files / VLOOKUP Join Sheets
Append rows from multiple files/tabs or join two sheets by a key column.
Option A: Stack / Append All Open Sheet Tabs
Option B: VLOOKUP / Left-Join Two Sheets by Key
Format Preview & Export Converter
Column Profiler & Quick Summary
| Col | Header | Filled | Blank | Unique | Dupes | Min / Max / Avg |
|---|
Paste CSV, TSV, Markdown Table, JSON, or HTML
Confirm Action
Create a Viral Bar Chart Race in 30 Seconds
Bar chart races drive massive organic engagement on TikTok, YouTube Shorts, Instagram Reels, and LinkedIn because viewers stay hooked to see who wins the ranking battle. Videos under 30 seconds average over 85% audience retention — the critical threshold algorithms require to trigger recommendation waves.
Step-by-Step Visual Studio Tour
Every control is accessible on a single screen: live timeline scrubbing, audio presets, aspect ratio switching, and instant 1-click video export.
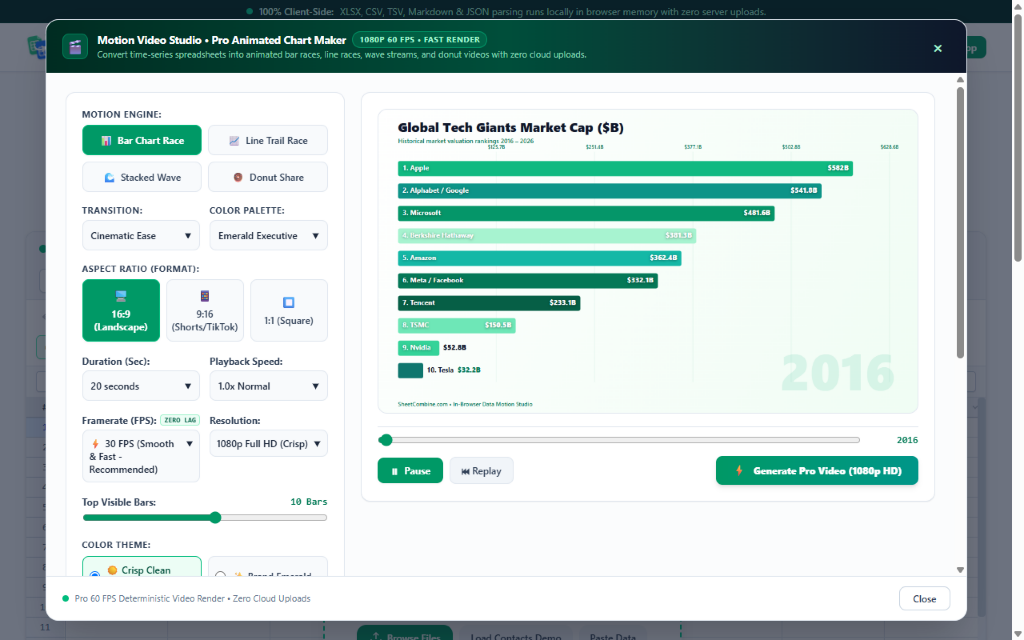
Deterministic Ranks
Zero bar collision. Each entity occupies a discrete pixel slot with 20px vertical clearance during rank crossovers.
Procedural Audio
4 royalty-free synthesizer presets (Lo-Fi Chill, Corporate Uplift, Modern Tech Pulse) or upload custom MP3 files.
9:16 & 16:9 Ratios
Toggle between 9:16 full-bleed mobile vertical and 16:9 widescreen YouTube formats with 1 click.
Instant Stop & Export
Download your video at any second. MediaRecorder captures directly to WebM or MP4 with zero cloud encoding delay.
Supported CSV & Excel Data Formats
SheetCombine automatically parses both Wide and Long data formats. Wide format is recommended for spreadsheet authors.
Place entity names in the first column, and dates or years across consecutive columns in the header row.
- Easiest to edit directly in Microsoft Excel or Google Sheets
- Add new time steps by adding a column to the right
- Supports numeric, dollar, and percentage values
Contains 3 dedicated columns: Time (Date/Year), Entity (Name), and Value (Metric).
- Ideal for exports generated by SQL queries or Python scripts
- Handles irregular time intervals cleanly
- Auto-detected and pivoted automatically in browser RAM
Video Export Specifications
Tailored aspect ratios, bitrates, and audio encoding specs for every social media publishing channel.
| Specification | 9:16 Vertical (Mobile) | 16:9 Landscape (Desktop) | 1:1 Square (Social Feed) |
|---|---|---|---|
| Resolution | 1080 × 1920 px (Full HD) | 1920 × 1080 px (Full HD) | 1080 × 1080 px |
| Target Platforms | TikTok, YouTube Shorts, Reels | YouTube, LinkedIn, TV, Keynote | Instagram Feed, LinkedIn Posts |
| Frame Rate | 60 FPS (Silky Smooth) | 60 FPS or 30 FPS | 60 FPS or 30 FPS |
| Video Codec | VP9 / WebM & MP4 | VP9 / WebM & MP4 | VP9 / WebM & MP4 |
| Audio Muxing | Hardware 48 kHz Stereo Opus | Hardware 48 kHz Stereo Opus | Hardware 48 kHz Stereo Opus |
| Safe UI Margins | Optimized for TikTok like/comment overlay | Standard 16:9 safe zone | Standard 1:1 safe zone |
| Export Pricing | Free (No watermark) | Free (No watermark) | Free (No watermark) |
Why Creators Choose SheetCombine Over Heavy Cloud Animators
Compare SheetCombine's instant in-browser video renderer with the cloud queues, mandatory signups, and paywalls of traditional tools.
| Feature / Dimension | SheetCombine | Flourish Studio | Canva / After Effects |
|---|---|---|---|
| Sign-Up & Account Gate | Zero account or login required | Mandatory email sign-up | Mandatory account or Adobe CC license |
| Video Encoding Speed | Instant GPU capture (0s cloud wait) | 2–5 minute cloud render queue | Heavy local render or cloud wait |
| Data Confidentiality | 100% In-Browser RAM (0 bytes sent to server) | Public mode exposes data to public web | Syncs assets to proprietary cloud |
| TikTok / Shorts Format (9:16) | Native 1-Click 9:16 Vertical Preset | Difficult manual CSS iframe cropping | Requires manual canvas adjustment |
| Frame Rate | Silky 60 FPS Hardware Render | Typically 30 FPS web playback | 30–60 FPS depending on timeline settings |
| Pricing | Free in-browser tool | Free with watermark, $100+/mo for teams | $15–$55/month subscription |
How to Make a Bar Chart Race from Excel/CSV in 5 Steps
Prepare Your Time-Series Table
Set entity names in Column A (e.g. Companies, Athletes, Countries) and consecutive time steps across Row 1 (e.g. 2018, 2019, 2020, 2021). Enter numeric values for each cell.
Drop File into the Editor
Drag and drop your .xlsx or .csv file into the spreadsheet grid above, or click one of the pre-loaded starter datasets (Tech Giants, Top Unicorns, World GDP).
Select Aspect Ratio & Soundtrack
Click 9:16 Vertical for TikTok, Shorts, and Reels, or 16:9 Landscape for YouTube. Choose background audio (Corporate Uplift, Tech Pulse, Lo-Fi Chill) or upload custom audio.
Tune Speed & Palette
Adjust animation duration (15s to 60s), playback speed multiplier, and color palette (Emerald Executive, Cyberpunk Neon, Sunset Coral, Bloomberg Financial).
Click Start Recording & Download
Press Start Video Recording to record at 60 FPS with hardware audio muxing. Stop at any second to immediately download your clean 1080p video file.
Frequently Asked Questions
How do I make a bar chart race from an Excel or CSV file?
Format your spreadsheet with entity names (companies, countries, or athletes) in Column A, and historical time points (years, months, or quarters) in subsequent columns across Row 1. Drop your CSV or XLSX file into SheetCombine, click Motion Studio, and the engine animates ranking transitions at 60 FPS with live count-up tickers. Choose your aspect ratio (9:16 Vertical or 16:9 Landscape) and click Start Video Recording to export an instant 1080p video.
What is the correct CSV format for a bar chart race?
SheetCombine supports both Wide Format and Long Format. Wide Format is the simplest: Column A contains entity names (e.g. "Brand"), while columns B through Z represent time stamps (e.g. "2018", "2019", "2020", "2021") with numeric values in every cell. Long Format uses 3 dedicated columns: Time, Entity, and Value. The engine automatically detects your column headers and maps them without manual configuration.
Can I export bar chart races in 9:16 vertical video for TikTok, Shorts, and Reels?
Yes. Toggle to 9:16 Vertical inside Motion Studio. The canvas recalculates layout margins, increases entity label font size for mobile screens, and positions live rank tickers for full-bleed 1080x1920 vertical video playback on mobile feeds.
How does SheetCombine prevent overlapping bars and colliding text during rank swaps?
SheetCombine uses a deterministic integer-slot ranking algorithm instead of loose Euler spring accumulators. Each bar is locked to a non-overlapping pixel row slot with a mandatory 20-pixel vertical clearance buffer. Entity names and numeric values use dynamic binary-search text truncation and right-edge boundary guards, preventing text clipping and collisions at all speeds.
How long does 1080p video rendering take?
Export runs in real-time using local GPU canvas hardware capture. A 20-second bar chart race exports in exactly 20 seconds. You can also click Stop & Export at any second to truncate recording and immediately download the finished video file. Zero server queues, zero cloud processing delays.
Are there watermarks or hidden export fees?
No. All exported MP4 and WebM videos are 100% clean with zero watermarks, zero brand overlays, and zero required account logins. It is a completely free client-side utility.
Is my proprietary spreadsheet data secure?
Yes. SheetCombine operates with a strict 100% client-side privacy architecture. All data parsing, rank math, canvas tweening, and video compression execute locally in your web browser memory and GPU. Exactly zero bytes leave your computer or touch an external server.
Complementary Data & Visualization Utilities
4 multi-type motion engines: line race, stacked wave, donut share, and bar race.
Convert spreadsheets into interactive charts and Power BI-style KPI cards.
Full-featured in-browser spreadsheet editor with styled XLSX export.
Browse our complete directory of developer, format, and spreadsheet tools.