
Free Animated Chart Maker & Bar Chart Race Generator
Transform time-series Excel (.xlsx) and CSV tables into viral 60 FPS data motion graphics. Choose from Bar Chart Races, Line Growth Races, Stacked Waves, and Donut Shares with 1-click video export and zero server uploads.
1-Click Motion Starter Datasets
Drop XLSX, CSV, TSV, Markdown (.md), or JSON here
Runs locally inside browser memory. Multi-sheet workbooks open into tabs automatically.
Chart Studio & Power BI Visualizer
Client-Side RAMConvert spreadsheet columns into publication-ready charts and instant KPI cards with zero server uploads.
Metric Breakdown
Interactive visualization rendered client-side
No Numerical Data Found
Please select a column containing numbers or load a sample dataset with revenue or quantity values.
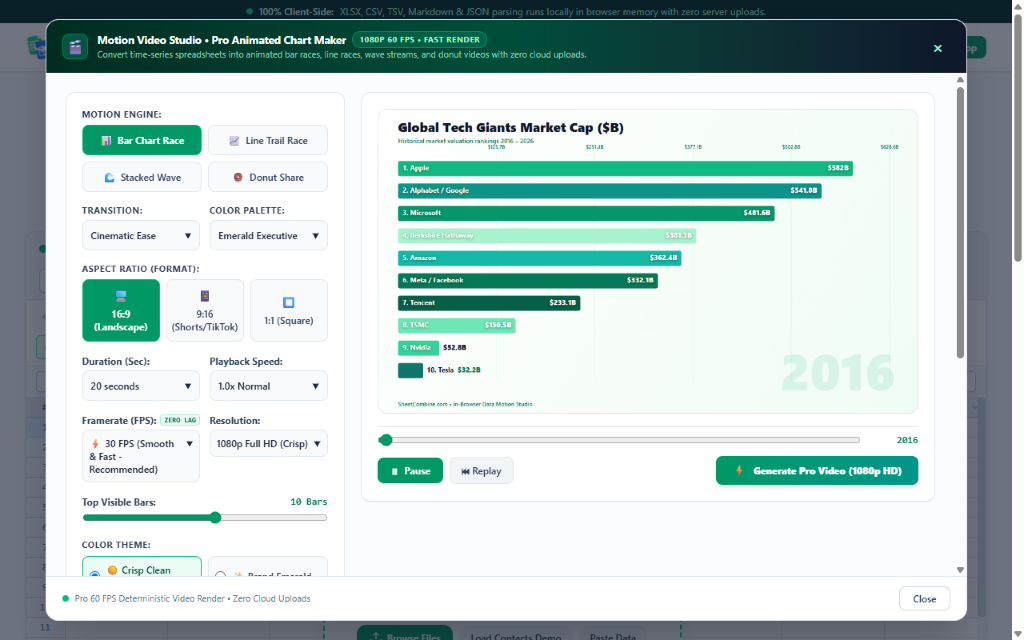
Motion Video Studio • Animated Chart Maker
Turn spreadsheet numbers into animated videos for TikTok, YouTube Shorts, LinkedIn, and presentations.
Creating Your Video
Rendering animation directly on your device...
Spreadsheet Macros & Automation Studio
Client-Side EngineExecute 1-click pro data cleaning recipes or record custom macros to replay repetitive workflows across sheets.
✨ 1-Click Pro Data Cleaners & Transformers
Instantly transforms active sheet data with full Undo (Ctrl+Z)Strip leading/trailing spaces, collapse multiple spaces, and remove non-printable characters across all cells.
Format row 1 into clean Title Case with styled emerald header background and white bold typography.
Strip $, €, £, commas, and trailing symbols from numbers so formulas and charts calculate without error.
Append a styled Total / Summary row at the bottom computing total sums and averages for numerical columns.
Detect Full Names in selected column and cleanly split into adjacent "First Name" and "Last Name" columns.
Remove identical or case-insensitive duplicate rows across the sheet while preserving header row intact.
Insert or re-number Column A with sequential row numbers (1, 2, 3...) or custom prefix (ID-001, ID-002...).
⏺️ Macro Recorder & Replay Engine
Record custom spreadsheet actions in real time and save them locally to replay on any uploaded CSV or Excel sheet.
Combine Two or More Columns
Merge 2+ columns cleanly without writing formulas.
Split Column by Delimiter
Remove Duplicate Rows
Find & Replace
Sort Rows
Filter or Delete Matching Rows
Fill, Prefix / Suffix & Extract Column
Merge Multiple Files / VLOOKUP Join Sheets
Append rows from multiple files/tabs or join two sheets by a key column.
Option A: Stack / Append All Open Sheet Tabs
Option B: VLOOKUP / Left-Join Two Sheets by Key
Format Preview & Export Converter
Column Profiler & Quick Summary
| Col | Header | Filled | Blank | Unique | Dupes | Min / Max / Avg |
|---|
Paste CSV, TSV, Markdown Table, JSON, or HTML
Confirm Action
4 High-Impact Motion Engines in One In-Browser Suite
Switch between 4 visual animation formats with a single click. Every mode renders at 60 frames per second with custom physics.
Bar Chart Race
The internet's most viral data format. Horizontal bars smoothly reorder with spring easing and live count-up tickers.
TikTok & Shorts FavoriteLine Growth Race
Flowing multi-line trajectory trails with glowing leader dots and historical area fills showing time-series momentum.
MRR & Growth TrajectoriesStacked Wave Stream
Fluid stacked volume layers highlighting category expansion, overall market growth, and relative contribution.
Volume & Share TrendsMorphing Donut Share
Smoothly expanding and contracting percentage segments showing market share dominance shift over time.
Market Share EvolutionCurated High-Contrast Color Palettes & Easing Physics
High-readability color schemes designed specifically for fast-scrolling mobile feeds and high-definition video compression.
Emerald Executive
Professional corporate greens and teals tailored for executive reporting.
Cyberpunk Neon
Ultra-high contrast electric cyan, magenta, and gold engineered for dark feeds.
Sunset Coral
Warm gradient sunset tones ideal for lifestyle, demographic, and consumer trends.
Bloomberg Financial
Classic Wall Street navy and amber tones for macroeconomics and market caps.
How do you create an animated bar chart race from an Excel or CSV file?
To create an animated bar chart race from a spreadsheet, upload a CSV or XLSX file containing a time column (years, dates, or months), an entity column (companies, countries, or names), and a numeric value column. In SheetCombine's in-browser Motion Studio, the engine smoothly animates bars ranking in real-time at 60 frames per second with live number tickers and ranking position interpolation. You can customize speed, colors, and aspect ratio (16:9 Landscape for YouTube or 9:16 Vertical for TikTok and Reels) and export a high-definition MP4 or WebM video directly from your browser memory with zero server uploads or cloud wait times.
Why Creators Choose SheetCombine Over Heavy Cloud Animators
Compare SheetCombine's instant in-browser video renderer with the cloud queues, mandatory signups, and paywalls of traditional tools.
| Feature / Dimension | SheetCombine Motion Studio | Flourish Studio | Canva / After Effects |
|---|---|---|---|
| Sign-Up & Account Gate | Zero account or login required | Mandatory email sign-up | Mandatory account or Adobe CC license |
| Video Encoding Speed | Instant (Real-time local GPU capture with 1-click stop) | 2–5 minute cloud render queue | Heavy local render or cloud wait |
| Motion Styles | 4 Types (Bar Race, Line Race, Stacked Wave, Donut) | Bar Race Only | Requires manual keyframe scripting |
| Data Confidentiality | 100% In-Browser RAM (0 bytes sent to server) | Public mode exposes data to public web | Syncs assets to proprietary cloud |
| TikTok / Shorts Format (9:16) | Native 1-Click 9:16 Vertical Preset | Difficult manual CSS iframe cropping | Requires manual canvas adjustment |
| Frame Rate | Silky 60 FPS Hardware Render | Typically 30 FPS web playback | 30–60 FPS depending on timeline settings |
| Pricing | Free in-browser tool | Free with watermark, $100+/mo for teams | $15–$55/month subscription |
How to Create a Data Motion Video in 5 Steps
Upload or Select Time-Series Data
Drop any CSV or Excel file with historical timestamps into the grid, or click one of our 1-click starter templates (Tech Market Cap, World GDP, Monthly Channels).
Open 🎬 Motion Studio
Click the Motion Studio button to open the 60fps canvas player with your dataset preloaded and parsed.
Choose Motion Style, Palette & Aspect Ratio
Select Bar Race, Line Race, Stacked Wave, or Donut Share, pick your color palette, and choose 16:9 Landscape or 9:16 Vertical video.
Fine-Tune Speed, Physics & Duration
Adjust timeline scrubber, speed multiplier (0.5x–2x), transition physics (Spring, Cinematic, Bounce), and duration (15s–60s).
Record & Instant Stop Download
Click Start Video Recording. Stop at any second with "⏹ Stop & Download" for an instant, crisp MP4/WebM video download with zero server queues.
Frequently Asked Questions About Data Motion Graphics
How do I create a bar chart race from an Excel spreadsheet or CSV file?
To create a bar chart race, prepare a spreadsheet with three core data columns: Time (Year, Month, or Date), Entity (Country, Company, Brand, or Name), and Value (Revenue, Population, Score, or Metric). Upload your CSV or XLSX into SheetCombine, click 🎬 Motion Studio, select your columns, and the engine animates ranking transitions and value tickers at 60 frames per second.
What motion video types are supported in SheetCombine Motion Studio?
SheetCombine supports 4 distinct motion visualization engines: (1) Horizontal Bar Chart Race with spring rank swaps, (2) Multi-Line Chart Race with glowing leader dot tracers, (3) Stacked Wave Streams showing volume distribution, and (4) Morphing Donut Share slices for evolving market share.
How does the video recording and export work without waiting or hanging?
SheetCombine records your animation directly from the HTML5 canvas using hardware-accelerated MediaRecorder API at 60 FPS with 100ms chunk streaming. You can let the animation complete automatically or click "⏹ Stop Recording & Export Now" at any second to immediately download your high-bitrate WebM or MP4 video.
What color palettes and transition physics can I choose?
Choose from curated high-contrast palettes: Emerald Executive (signature greens/teals), Cyberpunk Neon (high-contrast electric cyan/magenta), Sunset Coral (warm rose/amber/cyan), Bloomberg Financial (Wall Street navy/amber), or Official Corporate Brand Colors. Transition physics include Elastic Spring, Cinematic Ease-In-Out, Overshoot Bounce, and Steady Linear.
What aspect ratios are supported for social media publishing?
Toggle seamlessly between 9:16 Vertical (full-bleed for TikTok, YouTube Shorts, and Instagram Reels), 16:9 Landscape (optimized for YouTube, LinkedIn, and PowerPoint pitch decks), and 1:1 Square (optimized for Instagram and LinkedIn feed posts).
Is my confidential company data uploaded to any remote server or cloud queue?
Never. SheetCombine operates with a strict 100% client-side privacy architecture. All data parsing, rank math, frame tweening, and video compression execute locally in your browser memory and GPU. Zero bytes ever leave your device or touch a server.
Complementary Data & Visualization Utilities
Direct CSV-to-video studio with 9:16 Shorts/Reels export and built-in procedural music.
Convert spreadsheets into interactive charts and Power BI-style KPI cards.
Full-featured in-browser spreadsheet editor with styled XLSX export.
Browse our complete directory of developer, format, and spreadsheet tools.